Monitoring systems generate enormous volumes of metrics every day. For many teams, Prometheus is the first choice because it’s reliable, flexible, and easy to operate. But as environments grow, one limitation becomes hard to ignore: Prometheus was never designed for long-term metric retention or global querying at scale.
This is where Thanos fits in. It extends Prometheus with durable storage, high availability, and a global query layer-without forcing you to replace your existing setup. This guide walks through the practical side of Thanos: how it works, how to set it up, and what to expect when you move from short-term metrics to a long-term, production-ready monitoring stack.
Why Prometheus Alone Isn’t Enough for Long-Term Metrics
Prometheus stores data locally and is optimized for recent metrics. That works well for alerting and short-term analysis, but it introduces challenges when:
- You need metrics older than a few weeks
- You want a single view across multiple clusters
- A Prometheus instance restarts or fails
- Storage costs start rising with local disks
Teams often try increasing retention or adding more storage, but that approach doesn’t scale cleanly. This is the problem Thanos long term storage was designed to solve.
Understanding Thanos Architecture (Without the Complexity)
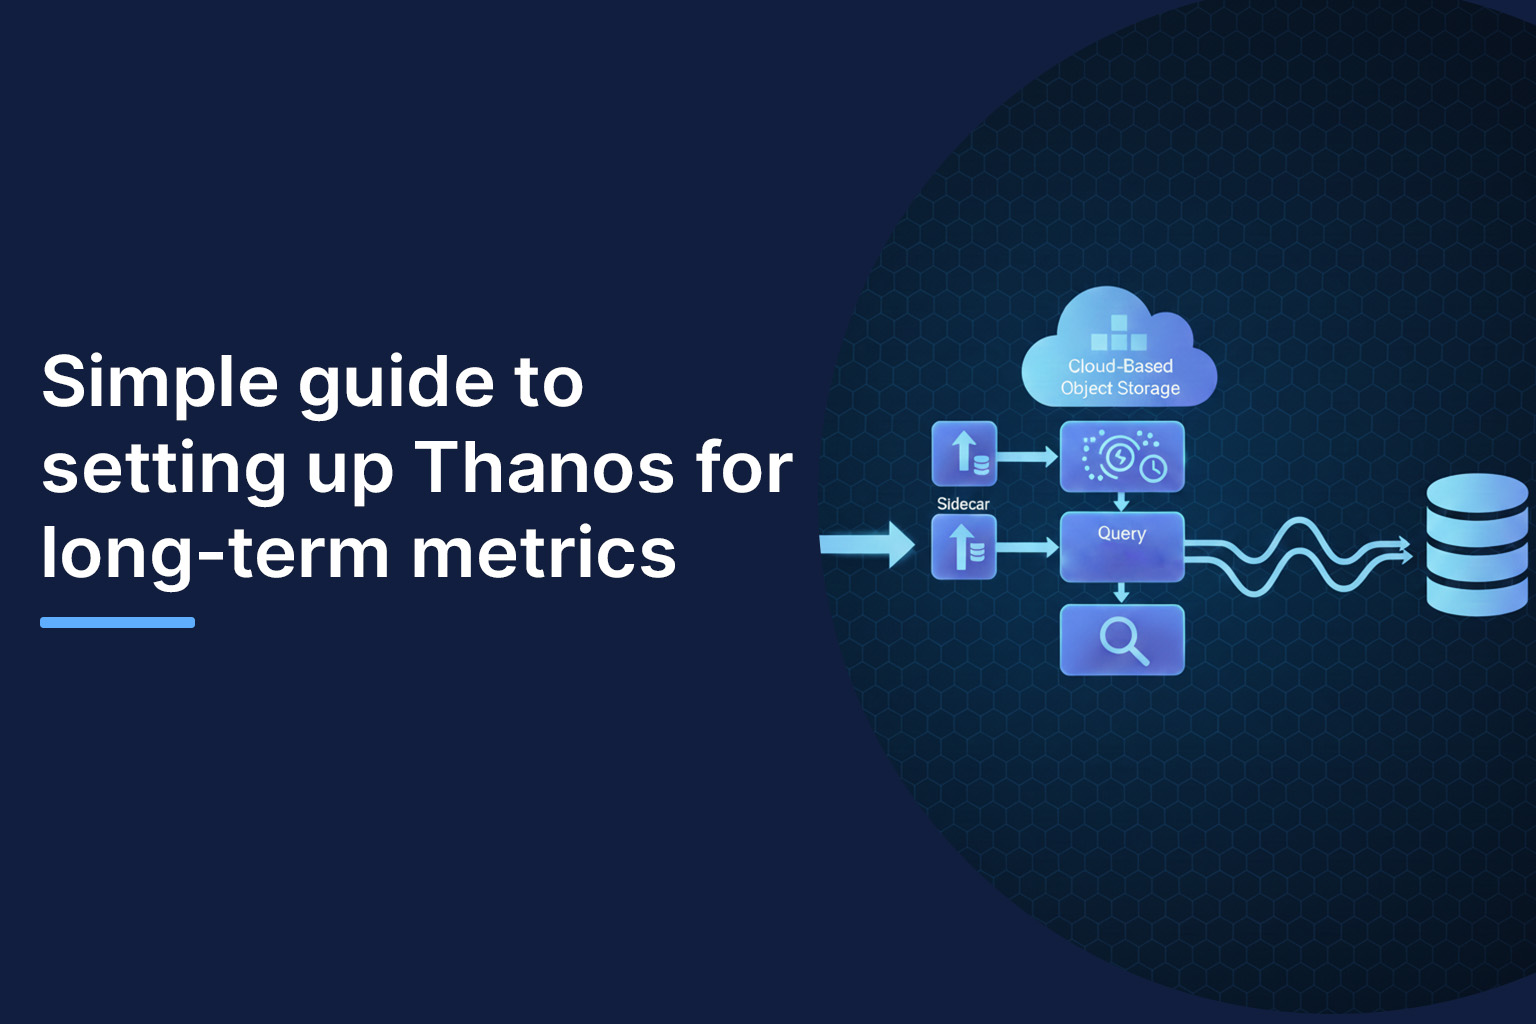
Before diving into setup steps, it helps to understand Thanos architecture at a high level. Thanos is not a replacement for Prometheus; it’s a layer on top of it.
Core Components of Thanos
Sidecar
Runs alongside Prometheus. It exposes metrics to Thanos and uploads historical data to object storage.
Object Storage
This is where long-term metrics live. Common options include S3, GCS, or compatible storage like MinIO.
Store Gateway
Reads historical blocks from object storage and serves them for queries.
Querier
Acts as a single query endpoint. It merges real-time Prometheus data with historical data from object storage.
Compactor
Optimizes and down-samples stored metrics to reduce storage cost and improve query performance.
Together, these components make Thanos with Prometheus scalable, fault-tolerant, and suitable for enterprise monitoring.
Thanos Setup Guide: Step-by-Step Approach
Step 1: Prepare Your Prometheus Setup
Start with a stable Prometheus deployment. Make sure:
- Metrics scraping is consistent
- Labels are standardized (cluster, environment, region)
- Retention is set for short-term needs (7–15 days is common)
Clean labeling early avoids confusion when querying long-term metrics later.
Step 2: Add the Thanos Sidecar
Deploy the Thanos sidecar alongside Prometheus. The sidecar:
- Uploads Prometheus blocks to object storage
- Exposes a gRPC endpoint for querying
At this stage, Prometheus still works exactly as before-no disruption to alerts or dashboards.
Step 3: Configure Object Storage for Long-Term Retention
This is the foundation of Thanos long term metrics.
Key considerations:
- Choose durable, low-cost object storage
- Enable versioning if supported
- Use encryption and access controls
A real-world example: one SaaS company reduced monitoring storage costs by nearly 40% after moving six months of metrics from local disks to object storage with Thanos.
Step 4: Deploy Thanos Querier for Unified Access
The Querier becomes the single endpoint for dashboards and users. It:
- Pulls recent data from Prometheus
- Fetches historical data from object storage via the Store Gateway
- Merges results seamlessly
Grafana dashboards usually work without modification-just point them to the Querier instead of Prometheus.
Step 5: Add Store Gateway and Compactor
As data volume grows, these components become critical.
- Store Gateway ensures fast access to historical metrics
- Compactor reduces data size through deduplication and down-sampling
Without a Compactor, object storage can grow unnecessarily fast, which affects both cost and query speed.
Comparing Prometheus Alone vs Thanos with Prometheus
| Capability | Prometheus Only | Thanos |
|---|---|---|
| Long-term metrics | Limited | Built-in |
| High availability | Manual | Native |
| Global querying | No | Yes |
| Storage cost control | Low | High |
| Multi-cluster view | No | Yes |
This comparison highlights why Thanos is often the next logical step rather than a full monitoring replacement.
Common Challenges During Thanos Setup (and How to Avoid Them)
Misconfigured Labels
Inconsistent labels can break deduplication and queries. Standardize labels early.
Underestimating Storage Costs
Object storage is cheaper than disks, but poor compaction can still inflate costs.
Operational Complexity
Thanos adds moving parts. Without clear ownership, troubleshooting can slow teams down.
This is where Thanos support services often make sense—especially for production or regulated environments.
When Enterprise Teams Should Consider Professional Support
For small setups, Thanos can be managed in-house. But as clusters multiply and compliance requirements increase, many teams opt for Thanos enterprise support.
Typical scenarios include:
- 24/7 monitoring environments
- Strict SLAs for metrics availability
- Regulated industries needing audit-ready observability
Thanos enterprise support services help with architecture design, upgrades, performance tuning, and incident response. They also reduce the operational burden on internal DevOps teams.
Best Practices for Long-Term Success with Thanos
- Keep Prometheus retention short and focused
- Regularly monitor compaction and storage growth
- Test query performance with historical data
- Document your Thanos architecture clearly
- Review access controls for object storage
These practices help ensure your Thanos long term storage strategy remains efficient and reliable as metrics grow.
Conclusion: Building a Scalable Long-Term Metrics Strategy
Thanos solves a real problem that Prometheus alone cannot: scalable, durable, long-term metrics without redesigning your monitoring stack. By following a structured Thanos setup guide, teams can extend existing Prometheus deployments into a robust, enterprise-ready observability platform.
Whether you’re running a few clusters or managing global infrastructure, Thanos with Prometheus offers flexibility, cost efficiency, and operational resilience. For organizations that want predictable performance and reduced operational risk, pairing the setup with Thanos enterprise support or reliable Thanos support services can make long-term monitoring far easier to manage.
About the Author